Introduction
Today, I setup my raspberry pi as a temperature sensor. I mainly use a LM35 temperature sensor and an IC “ADC0804” as an analog to digital converter. I also setup a database to record down the temperature data and then display result on web browser with Chat format. The connection of the whole electronics circuit is as below diagram. 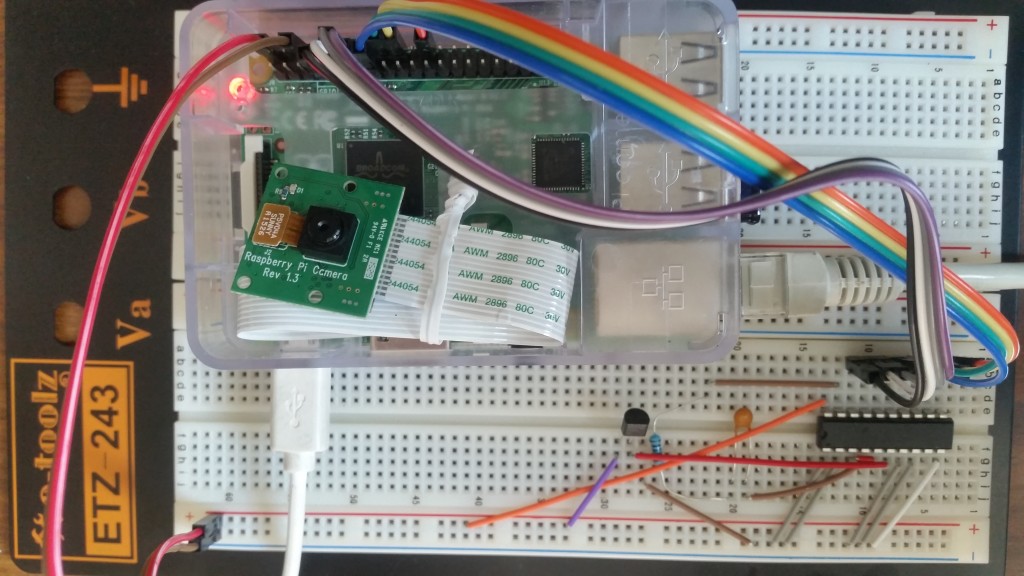
Program script:
1) The coding the a python program to take temperature data is as the temp_url.py program below:
#!/usr/bin/env python
# author: Powen Ko Program Name: temp_url.py
import time, RPi.GPIO as GPIO
import urllib
def fetch_thing(url, params, method):
params = urllib.urlencode(params)
if method==’POST’:
f = urllib.urlopen(url, params)
else:
f = urllib.urlopen(url+’?’+params)
return (f.read(), f.code)
GPIO.setmode(GPIO.BOARD)
GPIO.setup(7, GPIO.IN)
GPIO.setup(11, GPIO.IN)
GPIO.setup(12, GPIO.IN)
GPIO.setup(13, GPIO.IN)
GPIO.setup(15, GPIO.IN)
GPIO.setup(16, GPIO.IN)
GPIO.setup(18, GPIO.IN)
GPIO.setup(22, GPIO.IN)
while True:
a0 = GPIO.input(7)
a1 = GPIO.input(11)
a2 = GPIO.input(12)
a3 = GPIO.input(13)
a4 = GPIO.input(15)
a5 = GPIO.input(16)
a6 = GPIO.input(18)
a7 = GPIO.input(22)
total=a0+(a1*2)+(a2*4)+(a3*8)+(a4*16)+(a5*32)+(a6*64)+(a7*128)
temp=total*5*1000/256/10;
print a7,a6,a5,a4,a3,a2,a1,a0,”[“,total,”]”,”[C=”,temp,”]”
content, response_code = fetch_thing(
‘http://127.0.0.1/settemp.php’,
{‘id’: 1, ‘temp’: temp},
‘GET’
)
time.sleep(5)
2) Then, I save the temperature data into the database via a web php program as below:
<?php
$con=mysqli_connect(“localhost”,”root”,”infotech”,”raspberryDB”);
if (mysqli_connect_errno()) {
echo “Failed to connect to MySQL: ” . mysqli_connect_error();
}
$now= date(‘Ymdhms’);
$id = $_GET[‘id’];
$temp = $_GET[‘temp’];
mysqli_query($con,”INSERT INTO temp (datatime,temp,userid)
VALUES ($now,$temp,$id)”);
mysqli_close($con);
echo “powenko.com get it”.”, date time=”.$now.”, temp=”.$temp.”, id=”.$id;
?>
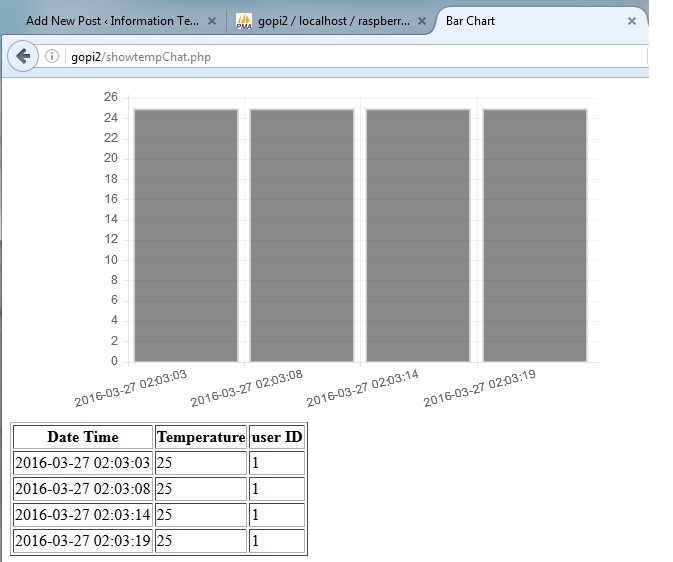
Finally, I view data by using a php web browser program as below and also screen dump result as below:
<!doctype html>
<html>
<head>
<title>Bar Chart</title>
<script src=”Chart.js-master/Chart.js”></script>
</head>
<body>
<div style=”width: 50%”>
<canvas id=”canvas” height=”450″ width=”800″></canvas>
</div>
<?php
$con=mysqli_connect(“localhost”,”root”,”infotech”,”raspberryDB”);
if (mysqli_connect_errno()) {
echo “Failed to connect to MySQL: ” . mysqli_connect_error();
}
$result = mysqli_query($con,”SELECT * FROM temp”);
echo “<table border=’1′>
<tr>
<th>Date Time</th>
<th>Temperature</th>
<th>user ID </>
</tr>”;
while($row = mysqli_fetch_array($result))
{
echo “<tr>”;
echo “<td>” . $row[‘datatime’] . “</td>”;
echo “<td>” . $row[‘temp’] . “</td>”;
echo “<td>” . $row[‘userid’] . “</td>”;
echo “</tr>”;
$Lables=$Lables.'”‘. $row[‘datatime’].'”,’;
$temps=$temps.'”‘. $row[‘temp’].'”,’;
}
echo “</table>”;
mysqli_close($con);
?>
<script>
var barChartData = {
labels : [<?php echo $Lables; ?>],
datasets : [
{
fillColor : “rgba(20,20,20,0.5)”,
strokeColor : “rgba(220,220,220,0.8)”,
highlightFill: “rgba(220,220,220,0.75)”,
highlightStroke: “rgba(220,220,220,1)”,
data : [<?php echo $temps; ?>
]
}
]
}
window.onload = function(){
var ctx = document.getElementById(“canvas”).getContext(“2d”);
window.myBar = new Chart(ctx).Bar(barChartData, {
responsive : true
});
}
</script>
</body>
</html>
