
1 Abstract
This document covers the operation of a distributed intrusion detection system.
This manual contains the following:
Chapter 2 Intrusion Detection Procedure
A short introduction to Intrusion detection technology, the procedure around the operations, and follow-up action regarding how to record and keep trace the incident.
Chapter 3 Intrusion Detection
This chapter describes the principles and working of an Intrusion Detection system.
Chapter 4 Component Description
This chapter describes the setup of the different components used in the secure setup.
The central management server will be responsible for the management of all the components.
Chapter 5 Network Setup
The network setup describes how the different components can be placed securely in a site’s network. This is done with centralized management, log consolidation and secure communications between the systems.
Chapter 6 Snort: -Installation, Configuration and Maintenance
This chapter describes the initial installation and configuration and the periodic maintenance.
Chapter 7 Analysis of the results
Analysis of the results obtained through the different IDS sensors have to be analyzed to be useful for the site. This chapter describes the usage of the Analysis Console for Intrusion Databases (ACID)
Chapter 8 Conclusion
This chapter contains the final conclusions of this paper.
2 Intrusion Detection Procedure
2.1 Introduction
An intrusion Detection System (IDS) does just as its name implies: It detects intrusions.
An IDS attempts to identify data traffic that is out of the ordinary and then notifies the appropriate individuals of the anomaly. It can be setup to monitor, detect, and then notify administrators of network attacks. A common problem with IDS is the amount of false alerts. False positives are when the IDS gives you a warning when it shouldn’t. Basically, a false positive is a false alarm. On the opposite end, you can get false negatives. In other words, someone compromises a IDS-monitored network and your IDS doesn’t detect it
An IDS requires a significant initial administration overhead to tweak the system for a particular network environment. If the administrator fails to properly configure the IDS, it is very likely that they will quickly become frustrated with the number of false positives received and may discontinue properly monitoring alerts.
2.2 Intrusion Response Policy
When the Intrusion Detection Systems recognizes an intrusion incident, it is important to take action to safeguard the Company resources.
The objectives of this policy are to:
- Determine how the incident happened.
- Establish a process for avoiding further exploitations of the same vulnerability.
- Avoid escalation and further incidents.
- Assess the impact and damage of the incident.
- Recover from the incident.
- Update procedures as needed.
- Determine who was responsible (if appropriate and possible). Of course, depending on the seriousness of the attack, all of the objectives above may not necessarily have to be activated.
Level 1 One instance of potentially unfriendly activity (finger, unauthorized telnet, (stealth) port scan, OS fingerprinting, etc.)
- Record user/IP address/domain of intruder.
- Maintain vigilance for future break-in attempts from this user.
Level 2 One instance of clear attempt to obtain unauthorized information or access (access restricted areas, buffer overflows, CGI attacks, IIS attacks, Internet worms, etc.) or a second Level 1 attack.
- Collect and protect information associated with the intrusion.
- Research origin of connection.
- Research potential risks related to intrusion method attempted.
- Upon identification of intruder, inform intruder of our knowledge of his actions and warn against future accusations if attempts are repeated.
Level 3 Serious attempts to breach security (denial of service attempts, etc.) or a second Level 2 attack.
- Contain the intrusion and decide what action to take.
- Collect and protect information associated with the intrusion.
- Notify the owner of the system being attacked of the situation and maintain notification of progress.
- Eliminate the intruder’s means of access and any related vulnerabilities.
- Research origin of connection.
- Research potential risks related to or damage caused by intrusion method used.
All potential, suspected, or known information security incidents should be reported to the Site Security Officer. The Site Security Officer will assemble all needed resources to handle the reported incident. The Site Security Officer will make decisions as to the interpretation of policy, standards and procedures when applied to the incident.
In the case of a level 2 or higher threat, the Site Security Officer will notify the Site IT Manager.
2.3 Documentation and reporting
Company IT Security Officer is responsible for overseeing and monitor the proper execution of the IDS Procedure, and he will perform the comprehensive weekly IDS result analysis. Besides, to remind that security officer is required to review/update the snort rule files regularly (e.g. monthly) in order to reflect the most up-to-date IDS detection rules.
The IDS results are reported and stored in the IDS Linux machine by using ACID tools, which will be detail described in Section 8 “Analysis of the results” in this document. IDS System and network log file, network message traffic, analysis results, administrator console logs and notes must be carefully collected, labeled and securely stored. Evidence and activity logs should be protected before, during and following the incident.
Any incident will firstly investigated by Security Officer, which will determine if it is a real security incident. If an incident (Level 1/2/3 as described in section 2.2) which Security Officer requests to take follow-up/corrective action locally, the incident will be recorded and kept trace according to COMPANY IT Helpdesk procedure. Hence, the progress on the incident can be monitor through COMPANY IT Helpdesk database. Moreover, the security incident will also register in Company CSIRT System in order to get PD awareness. All information security incidents must be documented. The documentation provides a reference to be used in case of other similar incidents.
2.3.1 Escalation procedure
1. Register incident in COMPANY IT Helpdesk. (Sensitive details must not be recorded in the Helpdesk.)
2. The incident is passed on to the local security officer for resolution
3. The security officer does a first assessment and classifies whether the incident is really a security incident. If so then continue with step 4.
4. Incident is logged into the Company CSIRT system (https://pww.csirt.it.corp.company.com/default.htm) with a reference to the incident call number.
The security manager solves the incident and logs the history in the CSIRT system.
5. The security officer reports resolution of the incident to the COMPANY IT helpdesk.
6. The incident is closed.
2.4 Response Actions
Some response action to internal users is required in the below priority “one” and “two” cases:
- Priority One – Protect restricted and/or internal data. Prevent exploitation of restricted systems (hr, finance, etc.) and networks. Inform the owner of the affected restricted system about already occurred penetrations.
- Priority Two – Protect other data. Prevent exploitations of other systems and networks and inform the owner of the already affected systems about successful penetrations.
- Priority Three – Prevent damage to systems (e.g., loss or alteration of system files, damage to disk drives, etc.). Damage to systems can result in costly down time and recovery.
- Priority Four – Minimize disruption of computing resources. It is better in many cases to shut a system down or to disconnect from a network than to risk damage to data or systems. Each data and system owner must evaluate the trade-off between shutting down and disconnecting, and staying up.
2.5 Scope of the policy
Site’s local subnet: meaning everything behind the site PGN router.
2.6 Exemptions
If there are business reasons for not following the outlined best practices it must be documented in the local security policy.
2.7 Proposed products for Intrusion Detection
- Snort for Network Intrusion Detection (NIDS)
- Tripwire for Host Intrusion Detection (HIDS)
2.8 Where does an IDS fit with the rest of my security plan?
IDSs are a great addition to a network’s defense-in-depth architecture. They can be used to identify vulnerabilities and weaknesses in your perimeter protection devices: for example, firewalls. The firewall rules can be verified regularly for functionality. In the event these devices are reconfigured, the IDS (NIDS) can provide auditing for change management control.
IDS logs can be used to enforce security policy and are a great source of forensic evidence.
Configured with the proper ruleset, a properly placed IDS can alert you to the presence of external/internal attacks.
3 Intrusion Detection
3.1 What is Intrusion Detection
“Intrusion detection is the process of identifying computing or network activity that is malicious or unauthorized. Most all Intrusion Detection Systems (IDS) have a similar structure and component set. This consists of a sensor (or agent) that monitors one or more data sources, applies some type of detection algorithm, and then initiates zero or more responses Usually there is a management system that provides for monitoring, configuration and analysis of intrusion data.”
An Intrusion Detection System, (IDS) provides an alert when an anomaly occurs that does not match a predefined baseline or if network activity matches a particular pattern (=rule) that can be recognized as an attack.
Firewalls and authentications are effective in protecting and preventing unauthorized access to the systems but lacks capabilities to monitor the network traffic where the majority of the attacks are taking place. Firewalls and authentication systems are vital, but they work at the point of entry to the network, if an attacker able to breaches the firewall he can roam freely through the network. To keep a constant eye on network traffic and to know anything out of ordinary is happening, network security must be supplemented with IDS.
There are two major types of intrusion detection: Network-based IDS (NIDS) which will sniff all network traffic and report on the results, and host-based IDS (HIDS) which will operate on one particular system and report only on items affecting that system.
- Network-based Intrusion Detection Systems (NIDSs) monitor a network segment and report alerts based on network traffic. The placement of the NIDS is important and understanding the typical traffic for that particular segment is crucial. One of the most time consuming tasks that determines the effectiveness of both types of IDS is establishing a baseline and tweaking the rule set to minimize false positives.
- Host-based Intrusion Detection Systems (HIDSs) reside on the host and can detect host-specific activity that is anomalous. They take a snapshot of the system and match it to the previous snap shot. E.g.: If the CPU cycles increase during off-business hours and a change to an executable program has also occurred a breach might be suspected or if their critical system files were modified or deleted, an alert is send to the administrator to investigate. HIDSs are specialized to the system nuances and can provide a level of detail that NIDSs are not privy to since they monitor entire network segments.
Both types of intrusion detection can be a critical component of the continuous audit process. Intrusion detection can be considered a detective control, as it will identify circumstances where there has been a violation in policy.
3.2 Components
An IDS is made up of three main parts: the sensor, the database, and the analyst’s console. The database and analyst’s console often resides on the same machine. The sensor contains the scanning rules. Groups of IDSs functioning as remote sensors and reporting to a central management station are known as Distributed IDS (DIDS).
The components are covered in greater details in Chapter 4.
3.3 General Intrusion detection Principles
There are two approached to intrusion detection:
- Pattern Recognition (Signature Based) –Normal intrusion detection
Signature-based pattern recognition, also known as rules-based, uses a list of known attacks for which all traffic is compared to this list. As new exploit signatures become known, the database is updated and software requires signature updates. This is the most common type of IDS software generally available. Pattern recognition monitors all network traffic and then uses string matching to see if events occurring match a predefined signature. This type of IDS must have processing power capable of keeping up in real time since it is examining traffic on the wire in real time. A signature based IDS is similar to a virus detection program which asks the question “Does the rule match the behavior being observed? If so, send an alert.”
Following this process and performing frequent rule updates allows the IDS to constantly watch for the latest attacks. By operating in this fashion, the IDS is constantly playing catch-up with intruders. As a new attack is performed somewhere in the world, you have to wait for a signature for the attack to be determined, and then add it to the rules for your IDS. During this time, the attack could conceivably happen to your network and you wouldn’t be aware of it. This is one of the principles problems with normal intrusion detection.
- Anomaly Detection –Policy-based intrusion detection
Alerts are generated whenever the system notices activity other than the normal network traffic. The dynamic nature of network computing makes this type of IDS particularly susceptible to false positives. The assumption here is that all intrusive events are considered anomalies. In order to do this, a profile of what is considered “normal” activity must be built first. Two unwanted possible scenarios result from this approach:
-An anomaly that is not intrusive is flagged as intrusive (a false positive)
-A true intrusion is not flagged as an anomaly (false negative)
While the first scenario is considered annoying and misleading, the second scenario has the potential for extensive undetected damage. The process that is applied to reduce the number of false positives consist of running data through the system, establishing a “normal” baseline, and examining the number of false positives. This “tuning” process is repeated over and over again until the false positives are reduced to an acceptable level that provides meaningful alert and notification –an ongoing activity.
Policy-based IDS is almost a complete reversal of normal intrusion detection. With policy-based IDS, the IDS administrator defines what is normal and acceptable behavior for the network –setting the baseline.
The concept behind policy-based IDS is that whatever is not included as part of the list of acceptable behavior is potentially an intrusion. The IDS administrator goes through the often long and arduous process of determining what should not trigger an alert. Then, the IDS sends an alert on anything not previously defined by the administrator as acceptable traffic.
In many cases, policy-based IDS can make you aware of an attack faster than a typical IDS can.
The primary disadvantage to implement policy-based IDS is the amount of time and effort necessary to define the policy as to what acceptable behavior is. This is fairly simple in a small network, but in large enterprises, such as Company, it can be a very daunting task.
4 Component Description
4.1 Description
A distributed IDS (DIDS) is made up of four main parts: the sensor(s), the centralized syslog server, the database, and the analyst’s console. The last 2 components, -database and analyst’s console-, are often combined. Look at the following illustration showing the DIDS components.
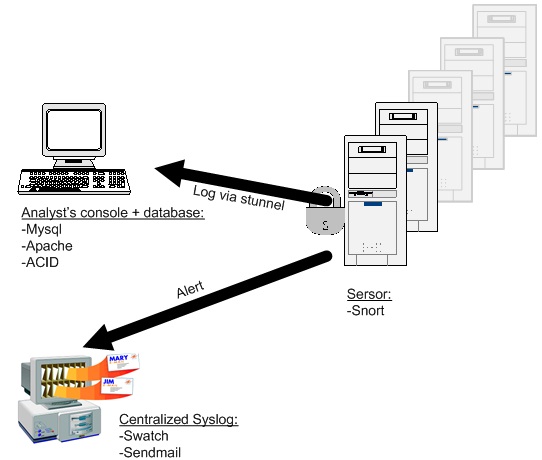
NIDS detection sensors are remotely located and report to a centralized management station (Analyst’s console + database). Attack logs are continuously uploaded to the management station and are stored in a central database; new attack signatures can be downloaded to the sensors on an as-needed basis. Alerts are forwarded to the centralized syslog server and used to notify the IDS administrator. Communication between the sensors and the management station is encrypted inside SSL.
4.2 Proposed software
-Snort: An open source signature-based Network Intrusion Detection System (NIDS). The signature-based IDS function is accomplished by using various rulesets. Snort database logging is done with Barnyard interfacing software.
-Stunnel: An universal open source SSL Wrapper
-Mysql: An open source database.
-Apache: An open source Web server
-ACID: ACID, which stands for Analysis Console for Intrusion Databases, is a web based log analysis tool.
-Swatch: An open source simple log watcher and filter that can be used in automation of responses to Snort alerts.
-SnortCenter: For Snort IDS Rule & Sensor management.
5 Network Setup
5.1 Where do I put my IDS?
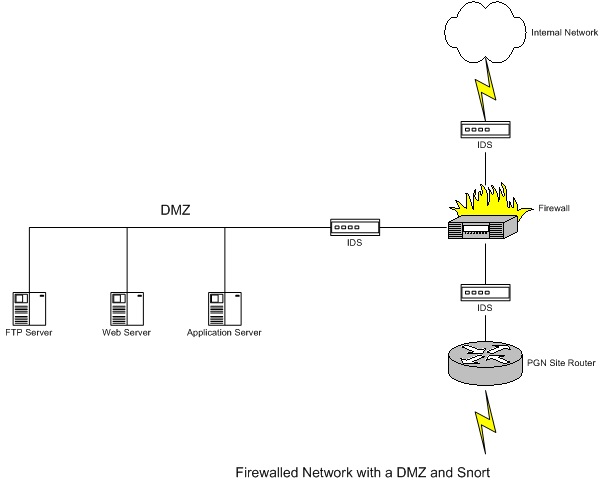
Although these questions are largely dependent on your environment, I will try to identify the most common places that intrusion detection mechanisms are installed on. Look at the following illustration showing common places to place the sensors.
Put the IDS system(s) on your network where it will be most usefulness. Where this is depends on several factors: size of the network and the amount of money/resources that can be spend on IDS systems.
As you can see on the above figure the logical places for the sensors are:
- Between your PGN site router (screening router) and your firewall.
- One inside the DMZ.
- On the inside of your firewall and/or one inside each subnet you want to protect.
The idea is to establish your network perimeter and to identify all potential points of entry to your network. Once found IDS sensors can be put in place and must be configured to report to a central management console.
5.2 IDS and switched networks
An IDS can be used on a switched network as well. As switches become increasingly popular, monitoring them with an IDS becomes more and more critical. You switch can either be inside your router or inside your firewall.
A switch provides you with layer 2 (Data Link layer of the OSI seven layer model) configurability, including virtual LAN (VLANs), which allows you to subnet directly at the switch.
In this case, you can connect the IDS system directly to the switch. The switch has a Switch Port Analyzer port (SPAN), which is where the IDS system will be connected. The IDS system then takes “copies” of the packets to be analyzed.
6 Snort –Installation, Configuration and Maintenance
6.1 Installation
Software and installation instructions are available from: http://www.snort.org
Current Snort version: 2.1.2
Available Installation documents:
- Snort Install Manual: Snort,Apache, PHP, MySQL and ACID install on RH9.0 by Patrick Harper (available from http://www.snort.org)
- How to setup and secure Snort, MySQL and Acid on FreeBSD 4.7 Release by Keith Tokash (available from http://www.snort.org)
- Snort 2.0 Intrusion Detection, Syngress, 2003 – chapter 2
General comment
Software to be installed and configured by C2L-T
6.2 Configuration
IDS intrusion mode: normal intrusion mode.
Implementing a policy-based IDS isn’t feasible due to the size of the Company network and the amount of administrative effort required to maintain the IDS.
Snort output (logging/alerting)
- Logs are written to the ACID database.
- Alerts are sent to the syslog where they are picked up by Swatch and sent via e-mail to notify a system administrator in real time so no one has to monitor the Snort output all day and night.
Configuration options:
- Deciding which rules to enable
- Configuring preprocessors for speed
- Using Generic Variables
Non-standard Snort rules to be stored in the local rules file named: local.rules
Event thresholding can be used to reduce the number of logged alerts for noisy rules. This can be tuned to significantly reduce false alerts. The thresholds should be defined and stored in the threshold file named: threshold.conf
6.3 Ongoing Maintenance
Once Snort is installed ongoing maintenance is required. To keep up with the development and use additional features that appear in new releases, periodic Snort engine updates are required.
To keep up with the latest vulnerabilities regular Snort Rules updates are required.
The most important updates are the rule updates that should be applied to the Snort sensors. Rule updates are created in response to emergencies. Rules can also be updated so that it will generate less false positives and/or false negatives. Several rule databases are updated on a regular basis and available at various web sites (www.snort.org, www.whitehats.com, etc.). In order to stay current with new attack detection continuously monitoring the sources for new rules and regularly updating the rule files is required. There are tools to automate this process.
7 Analysis of the results
Intrusion detection is not an automated process. It requires a human being to receive the alerts and react to them in a timely fashion. As expected, getting real-time alerts out of Snort and to yourself can be configured in a multitude of different ways. The two primary means for alerting are real-time alerting with syslog and swatch, and the Analysis Console for Intrusion Databases (ACID).
7.1 Using Swatch for real-time alerting
Swatch is a simple but powerful tool. Swatch monitors the syslog files for specific pre-configured events and when any of these events are matched, performs a certain action, such as sending a system administrator and e-mail about this event. All Snort critical Alerts are processed with Swatch.
7.2 Using ACID for data analysis
The Analysis Console for Intrusion Databases (ACID) is a web based log analysis tool, which can be used to analyze the events that Snort logged to the database. ACID provides the means to perform database queries, and database management –trimming and archiving of selected alerts and various graphing tools. ACID can group alerts into logically functional categories, and matches links to various common vulnerabilities and exposures (CVE) on the internet. CVE is a standardized classification of vulnerabilities and exposures, and a great resource for identifying and understanding attacks.
(The following text is taken from the Snort 2.0 Intrusion Detection book published by Syngress).
Using ACID is rather simple. Its screens are self-explanatory most of the time.
The below figure shows the main screen:
ACID Main Screen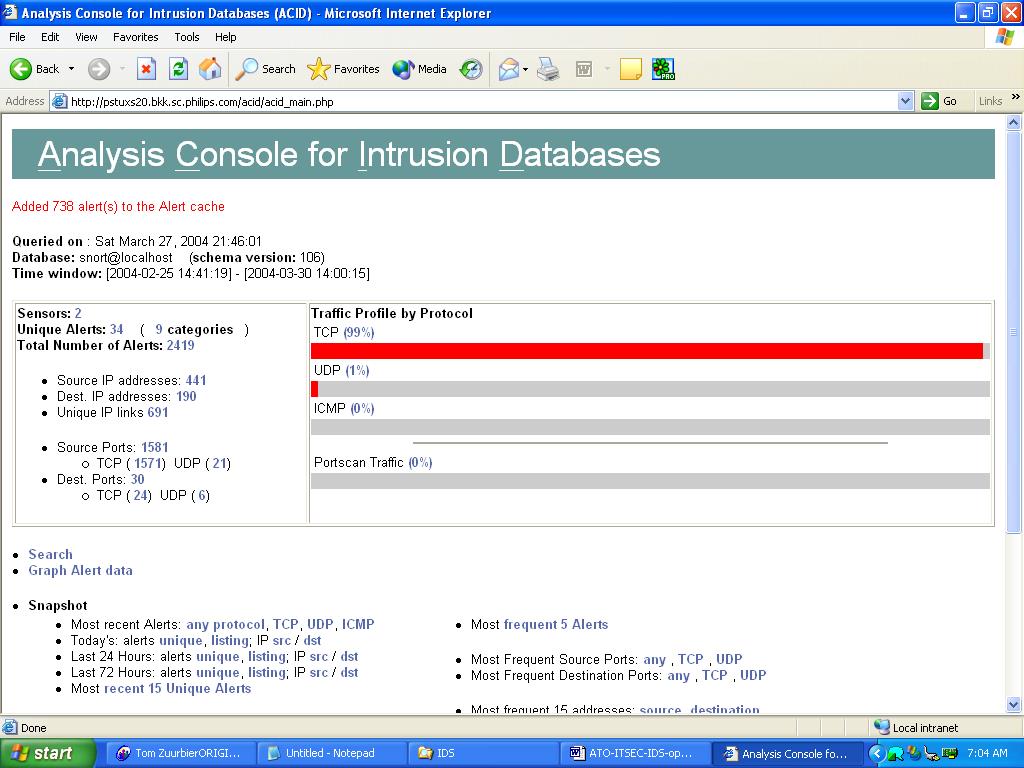
This screen shows the general statistics for ACID; namely the number of alerts divided by protocol, the counts of source and destination ports for triggered rules, and so forth. Clicking on a link provides additional details about the particular category.
The below figure provides an example listing of all the unique alerts (alerts grouped by the triggered rule).
Unique Alerts
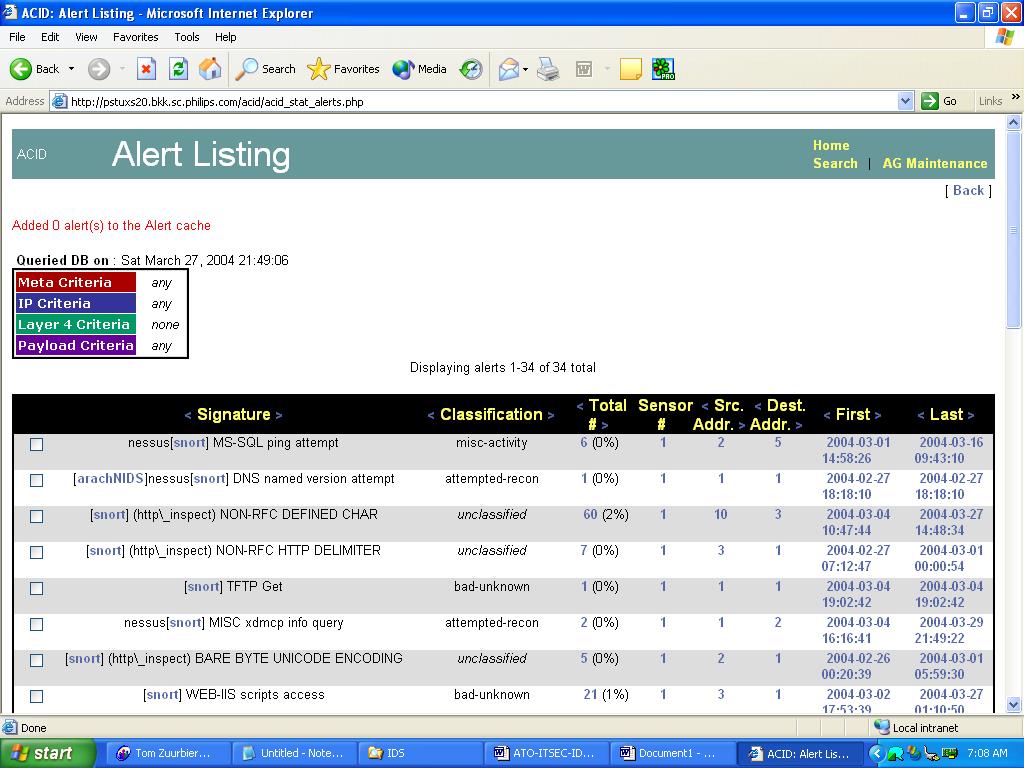
Each line (alert) has several clickable fields; the most interesting of these are probably the classification field and the references to various attack databases links (for example, snort or arachNIDS) This data is taken from the rules when Snort logs an alert to the database. If you click on the cve link in the line that has such a link in the Signature field, you will be taken to the description of this attack in CVE (a database of vulnerabilities). The Snort link leads to the similar description on the www.snort.org site. Classification helps group attacks by their type, which is also set up in the Snort rule file.
The unique alert display can be used for checking any “noisy” signatures and tuning them. You can sort the listing in ascending or descending order of number of alerts, and then select the ones that are triggered more often. Sorting is done by clicking on a corresponding arrow (> or <) in the header of the relevant column.
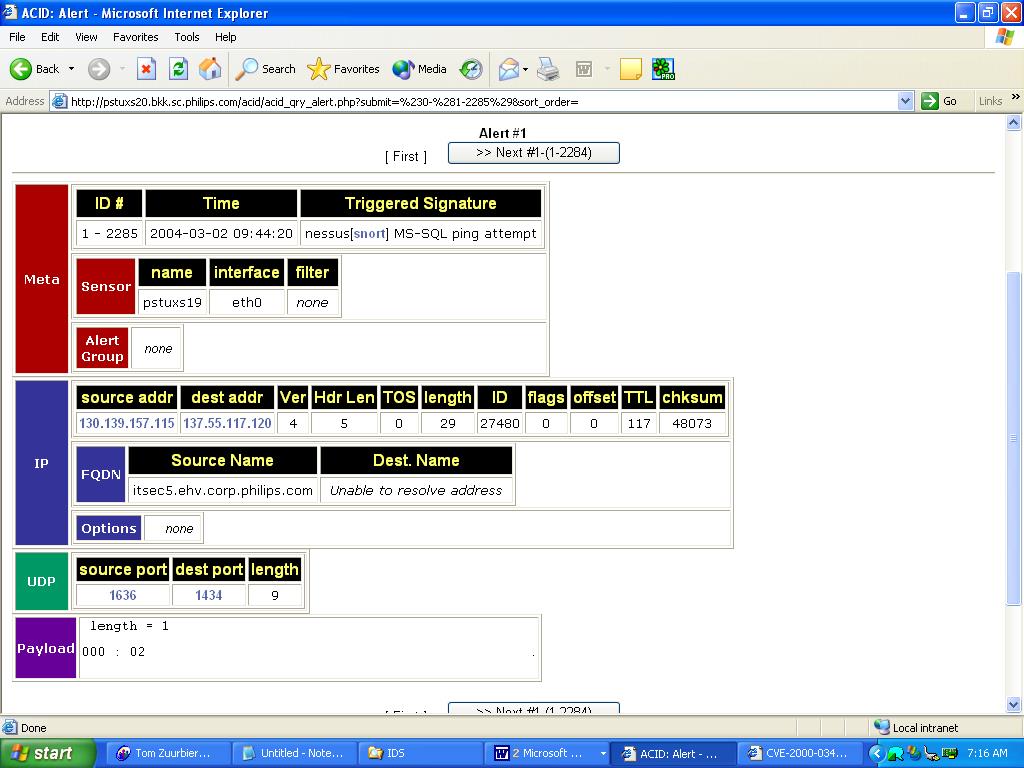
Each individual packet logged can be displayed in a decoded format, showing various flags, options, and packet contents (see figure on the next page).
Displaying a single alert
Querying the Database
One of the most important features of ACID is its searching tools. It is possible to create database queries with many parameters –from signature type to packet payload contents. The main search screen is show below:
Search Parameters
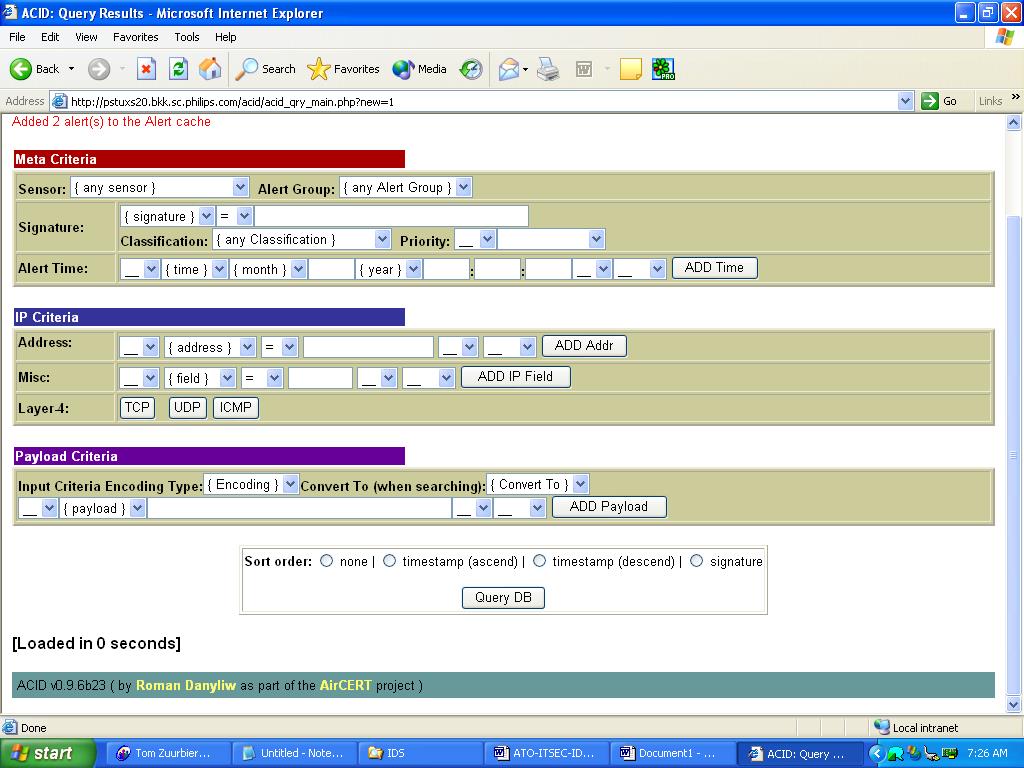
As you can see, in the Meta Criteria section it is possible to specify different Snort sensors, search in a specific alert group only (more about alert groups in the next section), and match signatures (exactly or by a sub string in their name), classification, and time periods. It is also possible to search only for packets with specific Layer 3 and Layer 4 information, plus perform a context search inside captured packets’ payload. For example, let’s find all alerts triggered by signatures related to the SQL Slammer worm. This can be achieved by specifying the signature field in meta criteria as roughly = sql slammer and clicking the Query DB button. The results of the query are shown below.
All SQL Slammer-related Alerts form the Database
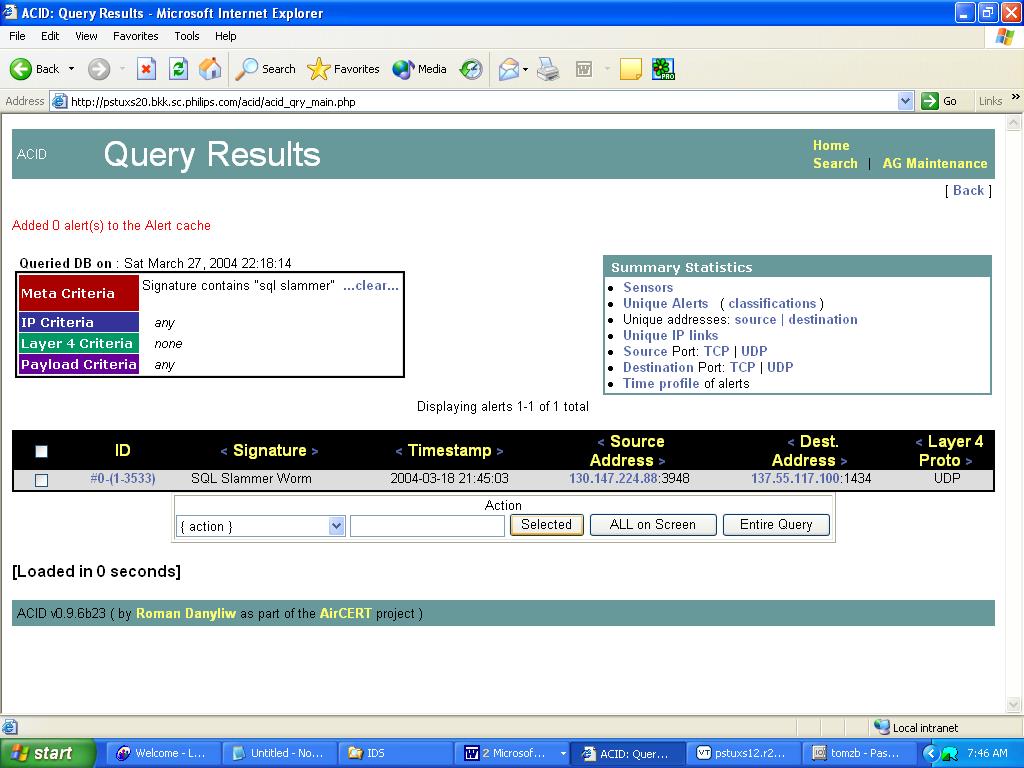
In the bottom-left corner is an action field, which specifies possible actions that can be done with the results of the query. The displayed alerts can be added to an alert group, deleted from the database, e-mailed or archived to another database. The three buttons on the right specify which alerts are used when performing the selected action.
Alert Groups
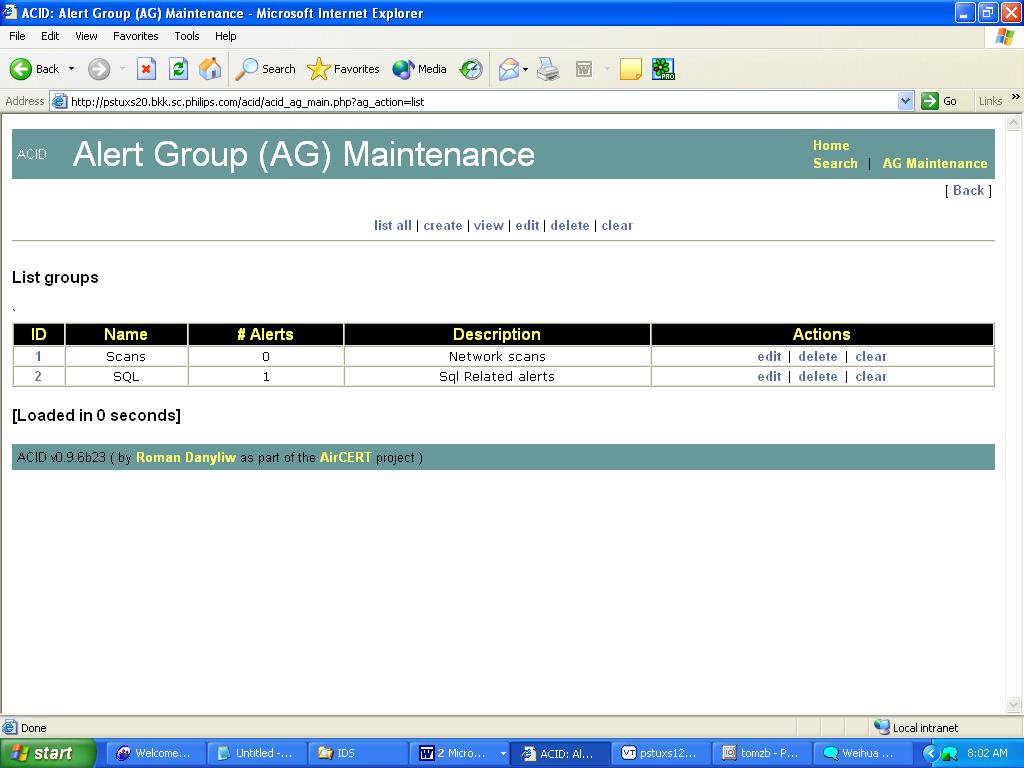
Alert groups are entities used to logically group various alerts. An alert group has a number, a text name, and commentary. For example, if you are researching a particular intrusion incident, you might be interested in putting all of the related alerts into one group, so you will be able to reference it in running queries, and so forth. To do grouping, you need to create the group first, When you click the link Alert Group (AG) Maintenance at the bottom of the ACID main screen, you are presented with the window shown on the following page.
Alert Group Maintenance
Graphical Features of ACID
ACID has a tool that can produce a graphical summary of alerts based on date, periods, alert group membership, source and destination ports, and IP addresses. An interface for the graph generation is shown below.
Alert Graphing
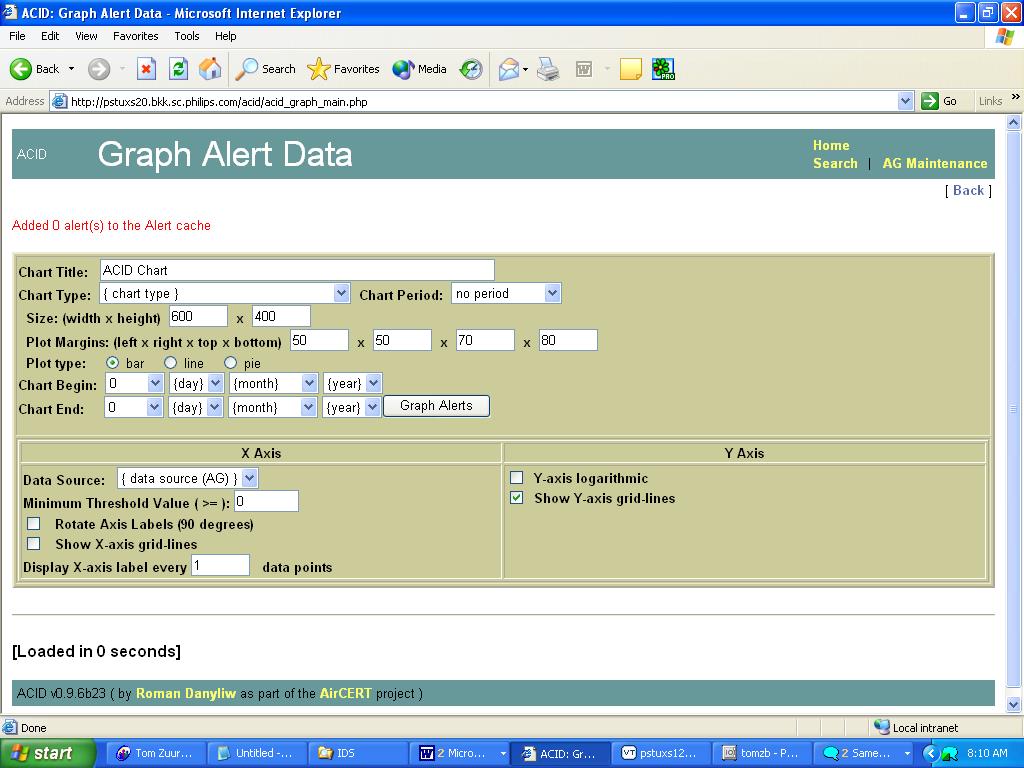
Many of the features within the graph parameters are relatively self-explanatory.
- The Chart Type parameter allows for the selection of a specific type of graph to be generated.
- The Data Source parameter allows limiting alerts by date, specified by the Chart Begin and Chart End parameters, and by alert group.
Another interesting feature is the Chart Period parameter. If nothing is selected here, the X-axis will list either all dates or all ports/Ips depending on the chart type. If you select a period such as a week or a day, all alerts are grouped by day of the week or hour of the day. This allows creation of statistics such as daily distribution of alerts depending on a day of week or time of day.
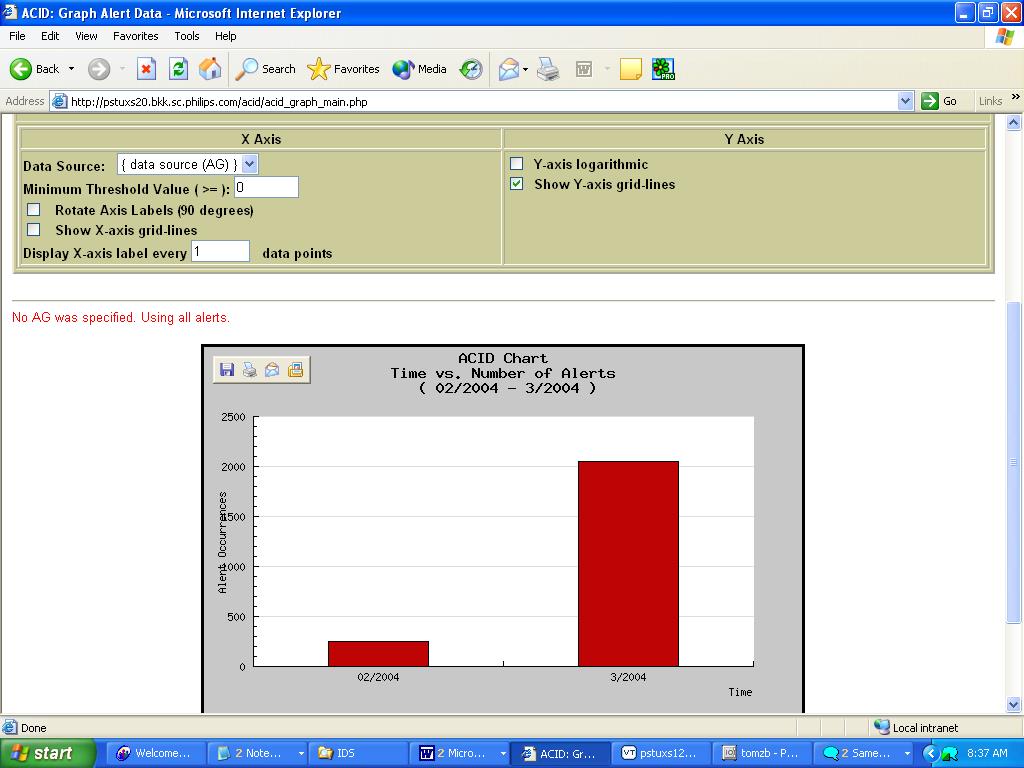
A Sample ACID Chart
8 Conclusion
An IDS is a necessary tool in any environment. Deploying IDS requires a lot of research and planning. Once configured correctly it will give you a lot of benefits, but if you neglect to properly configure it, IDS will give you a huge headache. Remember that security is not a patch, which you can implement and forget about. It is a constant changing concept that if not cared for will lead to disastrous results.
It is important to have a clear procedures and intrusion response policies for dealing with intrusions.
9 Bibliography
-Elizabeth D. Zwicky Building Internet Firewalls, 2000
-Brian Caswell Snort 2.0 Intrusion Detection, Syngress, 2003
-Josh Jacobs SSCP Study Guide, Syngress, 2003
-White papers from SANS
10 Appendix A: Resources
CERT-CC
Internet Engineering Task Force
Intrusion signatures data
Intrusion signatures data
http://cve.mitre.org/
Snort
http://www.snort.org
SANS (SysAdmin, Audit, Network, Security)
http://www.sans.org
Whitehats Network Security Resource
11 Appendix B: Snort Configuration File
Example /etc/snort/snort.conf
[root@hkhhkglco8ms040 snort]# cat snort.conf
#————————————————–
# http://www.snort.org Snort 2.1.0 Ruleset
# Contact: snort-sigs@lists.sourceforge.net
#————————————————–
# $Id: snort.conf,v 1.133 2003/12/18 17:05:07 cazz Exp $
#
###################################################
# This file contains a sample snort configuration.
# You can take the following steps to create your own custom configuration:
#
# 1) Set the network variables for your network
# 2) Configure preprocessors
# 3) Configure output plugins
# 4) Customize your rule set
#
###################################################
# Step #1: Set the network variables:
#
# You must change the following variables to reflect your local network. The
# variable is currently setup for an RFC 1918 address space.
#
# You can specify it explicitly as:
#
# var HOME_NET 10.1.1.0/24
#
# or use global variable $<interfacename>_ADDRESS which will be always
# initialized to IP address and netmask of the network interface which you run
# snort at. Under Windows, this must be specified as
# $(<interfacename>_ADDRESS), such as:
# $(\Device\Packet_{12345678-90AB-CDEF-1234567890AB}_ADDRESS)
#
# var HOME_NET $eth0_ADDRESS
#
# You can specify lists of IP addresses for HOME_NET
# by separating the IPs with commas like this:
#
# var HOME_NET [10.1.1.0/24,192.168.1.0/24]
#
# MAKE SURE YOU DON’T PLACE ANY SPACES IN YOUR LIST!
#
# or you can specify the variable to be any IP address
# like this:
var HOME_NET any
# Set up the external network addresses as well. A good start may be “any”
var EXTERNAL_NET any
# Configure your server lists. This allows snort to only look for attacks to
# systems that have a service up. Why look for HTTP attacks if you are not
# running a web server? This allows quick filtering based on IP addresses
# These configurations MUST follow the same configuration scheme as defined
# above for $HOME_NET.
# List of DNS servers on your network
var DNS_SERVERS $HOME_NET
# List of SMTP servers on your network
var SMTP_SERVERS $HOME_NET
# List of web servers on your network
var HTTP_SERVERS $HOME_NET
# List of sql servers on your network
var SQL_SERVERS $HOME_NET
# List of telnet servers on your network
var TELNET_SERVERS $HOME_NET
# List of snmp servers on your network
var SNMP_SERVERS $HOME_NET
# Configure your service ports. This allows snort to look for attacks destined
# to a specific application only on the ports that application runs on. For
# example, if you run a web server on port 8081, set your HTTP_PORTS variable
# like this:
#
# var HTTP_PORTS 8081
#
# Port lists must either be continuous [eg 80:8080], or a single port [eg 80].
# We will adding support for a real list of ports in the future.
# Ports you run web servers on
#
# Please note: [80,8080] does not work.
# If you wish to define multiple HTTP ports,
#
## var HTTP_PORTS 80
## include somefile.rules
## var HTTP_PORTS 8080
## include somefile.rules
var HTTP_PORTS 80
# Ports you want to look for SHELLCODE on.
var SHELLCODE_PORTS !80
# Ports you do oracle attacks on
var ORACLE_PORTS 1521
# other variables
#
# AIM servers. AOL has a habit of adding new AIM servers, so instead of
# modifying the signatures when they do, we add them to this list of servers.
var AIM_SERVERS [64.12.24.0/24,64.12.25.0/24,64.12.26.14/24,64.12.28.0/24,64.12.
29.0/24,64.12.161.0/24,64.12.163.0/24,205.188.5.0/24,205.188.9.0/24]
# Path to your rules files (this can be a relative path)
var RULE_PATH /etc/snort
# Configure the snort decoder
# ============================
#
# Snort’s decoder will alert on lots of things such as header
# truncation or options of unusual length or infrequently used tcp options
#
#
# Stop generic decode events:
#
# config disable_decode_alerts
#
# Stop Alerts on experimental TCP options
#
# config disable_tcpopt_experimental_alerts
#
# Stop Alerts on obsolete TCP options
#
# config disable_tcpopt_obsolete_alerts
#
# Stop Alerts on T/TCP alerts
#
# In snort 2.0.1 and above, this only alerts when the a TCP option is detected
# that shows T/TCP being actively used on the network. If this is normal
# behavior for your network, disable the next option.
#
# config disable_tcpopt_ttcp_alerts
#
# Stop Alerts on all other TCPOption type events:
#
# config disable_tcpopt_alerts
#
# Stop Alerts on invalid ip options
#
# config disable_ipopt_alerts
# Configure the detection engine
# ===============================
#
# Use a different pattern matcher in case you have a machine with very limited
# resources:
#
# config detection: search-method lowmem
###################################################
# Step #2: Configure preprocessors
#
# General configuration for preprocessors is of
# the form
# preprocessor <name_of_processor>: <configuration_options>
# Configure Flow tracking module
# ——————————-
#
# The Flow tracking module is meant to start unifying the state keeping
# mechanisms of snort into a single place. Right now, only a portscan detector
# is implemented but in the long term, many of the stateful subsystems of
# snort will be migrated over to becoming flow plugins. This must be enabled
# for flow-portscan to work correctly.
#
# See README.flow for additional information
#
# preprocessor flow: stats_interval 0 hash 2
# frag2: IP defragmentation support
# ——————————-
# This preprocessor performs IP defragmentation. This plugin will also detect
# people launching fragmentation attacks (usually DoS) against hosts. No
# arguments loads the default configuration of the preprocessor, which is a 60
# second timeout and a 4MB fragment buffer.
# The following (comma delimited) options are available for frag2
# timeout [seconds] – sets the number of [seconds] than an unfinished
# fragment will be kept around waiting for completion,
# if this time expires the fragment will be flushed
# memcap [bytes] – limit frag2 memory usage to [number] bytes
# (default: 4194304)
#
# min_ttl [number] – minimum ttl to accept
#
# ttl_limit [number] – difference of ttl to accept without alerting
# will cause false positves with router flap
#
# Frag2 uses Generator ID 113 and uses the following SIDS
# for that GID:
# SID Event description
# —– ——————-
# 1 Oversized fragment (reassembled frag > 64k bytes)
# 2 Teardrop-type attack
preprocessor frag2
# stream4: stateful inspection/stream reassembly for Snort
#———————————————————————-
# Use in concert with the -z [all|est] command line switch to defeat stick/snot
# against TCP rules. Also performs full TCP stream reassembly, stateful
# inspection of TCP streams, etc. Can statefully detect various portscan
# types, fingerprinting, ECN, etc.
# stateful inspection directive
# no arguments loads the defaults (timeout 30, memcap 8388608)
# options (options are comma delimited):
# detect_scans – stream4 will detect stealth portscans and generate alerts
# when it sees them when this option is set
# detect_state_problems – detect TCP state problems, this tends to be very
# noisy because there are a lot of crappy ip stack
# implementations out there
#
# disable_evasion_alerts – turn off the possibly noisy mitigation of
# overlapping sequences.
#
#
# min_ttl [number] – set a minium ttl that snort will accept to
# stream reassembly
#
# ttl_limit [number] – differential of the initial ttl on a session versus
# the normal that someone may be playing games.
# Routing flap may cause lots of false positives.
#
# keepstats [machine|binary] – keep session statistics, add “machine” to
# get them in a flat format for machine reading, add
# “binary” to get them in a unified binary output
# format
# noinspect – turn off stateful inspection only
# timeout [number] – set the session timeout counter to [number] seconds,
# default is 30 seconds
# memcap [number] – limit stream4 memory usage to [number] bytes
# log_flushed_streams – if an event is detected on a stream this option will
# cause all packets that are stored in the stream4
# packet buffers to be flushed to disk. This only
# works when logging in pcap mode!
#
# Stream4 uses Generator ID 111 and uses the following SIDS
# for that GID:
# SID Event description
# —– ——————-
# 1 Stealth activity
# 2 Evasive RST packet
# 3 Evasive TCP packet retransmission
# 4 TCP Window violation
# 5 Data on SYN packet
# 6 Stealth scan: full XMAS
# 7 Stealth scan: SYN-ACK-PSH-URG
# 8 Stealth scan: FIN scan
# 9 Stealth scan: NULL scan
# 10 Stealth scan: NMAP XMAS scan
# 11 Stealth scan: Vecna scan
# 12 Stealth scan: NMAP fingerprint scan stateful detect
# 13 Stealth scan: SYN-FIN scan
# 14 TCP forward overlap
preprocessor stream4: disable_evasion_alerts
# tcp stream reassembly directive
# no arguments loads the default configuration
# Only reassemble the client,
# Only reassemble the default list of ports (See below),
# Give alerts for “bad” streams
#
# Available options (comma delimited):
# clientonly – reassemble traffic for the client side of a connection only
# serveronly – reassemble traffic for the server side of a connection only
# both – reassemble both sides of a session
# noalerts – turn off alerts from the stream reassembly stage of stream4
# ports [list] – use the space separated list of ports in [list], “all”
# will turn on reassembly for all ports, “default” will turn
# on reassembly for ports 21, 23, 25, 53, 80, 143, 110, 111
# and 513
preprocessor stream4_reassemble
# http_inspect: normalize and detect HTTP traffic and protocol anomalies
#
# lots of options available here. See doc/README.http_inspect.
# unicode.map should be wherever your snort.conf lives, or given
# a full path to where snort can find it.
preprocessor http_inspect: global \
iis_unicode_map unicode.map 1252
preprocessor http_inspect_server: server default \
profile all \
ports { 80 8080 }
#
# Example unqiue server configuration
#
#preprocessor http_inspect_server: server 1.1.1.1 \
# ports { 80 3128 8080 } \
# flow_depth 0 \
# ascii no \
# double_decode yes \
# non_rfc_char { 0x00 } \
# chunk_length 500000 \
# non_strict \
# no_alerts
# rpc_decode: normalize RPC traffic
# ———————————
# RPC may be sent in alternate encodings besides the usual 4-byte encoding
# that is used by default. This plugin takes the port numbers that RPC
# services are running on as arguments – it is assumed that the given ports
# are actually running this type of service. If not, change the ports or turn
# it off.
# The RPC decode preprocessor uses generator ID 106
#
# arguments: space separated list
# alert_fragments – alert on any rpc fragmented TCP data
# no_alert_multiple_requests – don’t alert when >1 rpc query is in a packet
# no_alert_large_fragments – don’t alert when the fragmented
# sizes exceed the current packet size
# no_alert_incomplete – don’t alert when a single segment
# exceeds the current packet size preprocessor rpc_decode: 111 32771
# bo: Back Orifice detector
# ————————-
# Detects Back Orifice traffic on the network. Takes no arguments in 2.0.
#
# The Back Orifice detector uses Generator ID 105 and uses the
# following SIDS for that GID:
# SID Event description
# —– ——————-
# 1 Back Orifice traffic detected preprocessor bo
# telnet_decode: Telnet negotiation string normalizer
# —————————————————
# This preprocessor “normalizes” telnet negotiation strings from telnet and ftp
# traffic. It works in much the same way as the http_decode preprocessor,
# searching for traffic that breaks up the normal data stream of a protocol and
# replacing it with a normalized representation of that traffic so that the
# “content” pattern matching keyword can work without requiring modifications.
# This preprocessor requires no arguments.
# Portscan uses Generator ID 109 and does not generate any SID currently.
preprocessor telnet_decode
# Flow-Portscan: detect a variety of portscans
# —————————————
# Note: The Flow preprocessor (above) must first be enabled for Flow-Portscan t
o
# work.
#
# This module detects portscans based off of flow creation in the flow
# preprocessors. The goal is to catch catch one->many hosts and one->many
# ports scans.
#
# Flow-Portscan has numerous options available, please read
# README.flow-portscan for help configuring this option.
# Flow-Portscan uses Generator ID 121 and uses the following SIDS for that GID:
# SID Event description
# —– ——————-
# 1 flow-portscan: Fixed Scale Scanner Limit Exceeded
# 2 flow-portscan: Sliding Scale Scanner Limit Exceeded
# 3 flow-portscan: Fixed Scale Talker Limit Exceeded
# 4 flow-portscan: Sliding Scale Talker Limit Exceeded
# preprocessor flow-portscan: \
# talker-sliding-scale-factor 0.50 \
# talker-fixed-threshold 30 \
# talker-sliding-threshold 30 \
# talker-sliding-window 20 \
# talker-fixed-window 30 \
# scoreboard-rows-talker 30000 \
# server-watchnet [10.2.0.0/30] \
# server-ignore-limit 200 \
# server-rows 65535 \
# server-learning-time 14400 \
# server-scanner-limit 4 \
# scanner-sliding-window 20 \
# scanner-sliding-scale-factor 0.50 \
# scanner-fixed-threshold 15 \
# scanner-sliding-threshold 40 \
# scanner-fixed-window 15 \
# scoreboard-rows-scanner 30000 \
# src-ignore-net [192.168.1.1/32,192.168.0.0/24] \
# dst-ignore-net [10.0.0.0/30] \
# alert-mode once \
# output-mode msg \
# tcp-penalties on
# arpspoof
#—————————————-
# Experimental ARP detection code from Jeff Nathan, detects ARP attacks,
# unicast ARP requests, and specific ARP mapping monitoring. To make use of
# this preprocessor you must specify the IP and hardware address of hosts on
# the same layer 2 segment as you. Specify one host IP MAC combo per line.
# Also takes a “-unicast” option to turn on unicast ARP request detection.
# Arpspoof uses Generator ID 112 and uses the following SIDS for that GID:
# SID Event description
# —– ——————-
# 1 Unicast ARP request
# 2 Etherframe ARP mismatch (src)
# 3 Etherframe ARP mismatch (dst)
# 4 ARP cache overwrite attack
#preprocessor arpspoof
#preprocessor arpspoof_detect_host: 192.168.40.1 f0:0f:00:f0:0f:00
# Performance Statistics
# ———————-
# Documentation for this is provided in the Snort Manual. You should read it.
# It is included in the release distribution as doc/snort_manual.pdf
#
# preprocessor perfmonitor: console flow events time 10
####################################################################
# Step #3: Configure output plugins
#
# Uncomment and configure the output plugins you decide to use. General
# configuration for output plugins is of the form:
#
# output <name_of_plugin>: <configuration_options>
#
# alert_syslog: log alerts to syslog
# ———————————-
# Use one or more syslog facilities as arguments. Win32 can also optionally
# specify a particular hostname/port. Under Win32, the default hostname is
# ‘127.0.0.1’, and the default port is 514.
#
# [Unix flavours should use this format…]
# output alert_syslog: LOG_AUTH LOG_ALERT
#
# [Win32 can use any of these formats…]
# output alert_syslog: LOG_AUTH LOG_ALERT
# output alert_syslog: host=hostname, LOG_AUTH LOG_ALERT
# output alert_syslog: host=hostname:port, LOG_AUTH LOG_ALERT
# log_tcpdump: log packets in binary tcpdump format
# ————————————————-
# The only argument is the output file name.
#
# output log_tcpdump: tcpdump.log
# database: log to a variety of databases
# —————————————
# See the README.database file for more information about configuring
# and using this plugin.
#
# output database: log, mysql, user=root password=test dbname=db host=localhost
# output database: alert, postgresql, user=snort dbname=snort
# output database: log, unixodbc, user=snort dbname=snort
# output database: log, mssql, dbname=snort user=snort password=test
# unified: Snort unified binary format alerting and logging
# ————————————————————-
# The unified output plugin provides two new formats for logging and generating
# alerts from Snort, the “unified” format. The unified format is a straight
# binary format for logging data out of Snort that is designed to be fast and
# efficient. Used with barnyard (the new alert/log processor), most of the
# overhead for logging and alerting to various slow storage mechanisms such as
# databases or the network can now be avoided.
#
# Check out the spo_unified.h file for the data formats.
#
# Two arguments are supported.
# filename – base filename to write to (current time_t is appended)
# limit – maximum size of spool file in MB (default: 128)
#
# output alert_unified: filename snort.alert, limit 128
# output log_unified: filename snort.log, limit 128
# You can optionally define new rule types and associate one or more output
# plugins specifically to that type.
#
# This example will create a type that will log to just tcpdump.
# ruletype suspicious
# {
# type log
# output log_tcpdump: suspicious.log
# }
#
# EXAMPLE RULE FOR SUSPICIOUS RULETYPE:
# suspicious $HOME_NET any -> $HOME_NET 6667 (msg:”Internal IRC Server”;)
#
# This example will create a rule type that will log to syslog and a mysql
# database:
# ruletype redalert
# {
# type alert
# output alert_syslog: LOG_AUTH LOG_ALERT
# output database: log, mysql, user=snort dbname=snort host=localhost
# }
#
# EXAMPLE RULE FOR REDALERT RULETYPE:
# redalert tcp $HOME_NET any -> $EXTERNAL_NET 31337 \
# (msg:”Someone is being LEET”; flags:A+;)
#
# Include classification & priority settings
#
include classification.config
#
# Include reference systems
#
include reference.config
####################################################################
# Step #4: Customize your rule set
#
# Up to date snort rules are available at http://www.snort.org
#
# The snort web site has documentation about how to write your own custom snort
# rules.
#
# The rules included with this distribution generate alerts based on on
# suspicious activity. Depending on your network environment, your security
# policies, and what you consider to be suspicious, some of these rules may
# either generate false positives ore may be detecting activity you consider to
# be acceptable; therefore, you are encouraged to comment out rules that are
# not applicable in your environment.
#
# The following individuals contributed many of rules in this distribution.
#
# Credits:
# Ron Gula <rgula@securitywizards.com> of Network Security Wizards
# Max Vision <vision@whitehats.com>
# Martin Markgraf <martin@mail.du.gtn.com>
# Fyodor Yarochkin <fygrave@tigerteam.net>
# Nick Rogness <nick@rapidnet.com>
# Jim Forster <jforster@rapidnet.com>
# Scott McIntyre <scott@whoi.edu>
# Tom Vandepoel <Tom.Vandepoel@ubizen.com>
# Brian Caswell <bmc@snort.org>
# Zeno <admin@cgisecurity.com>
# Ryan Russell <ryan@securityfocus.com>
#=========================================
# Include all relevant rulesets here
#
# The following rulesets are disabled by default:
#
# web-attacks, backdoor, shellcode, policy, porn, info, icmp-info, virus,
# chat, multimedia, and p2p
#
# These rules are either site policy specific or require tuning in order to not
# generate false positive alerts in most enviornments.
#
# Please read the specific include file for more information and
# README.alert_order for how rule ordering affects how alerts are triggered.
#=========================================
include $RULE_PATH/local.rules
include $RULE_PATH/bad-traffic.rules
include $RULE_PATH/exploit.rules
include $RULE_PATH/scan.rules
include $RULE_PATH/finger.rules
include $RULE_PATH/ftp.rules
include $RULE_PATH/telnet.rules
include $RULE_PATH/rpc.rules
include $RULE_PATH/rservices.rules
include $RULE_PATH/dos.rules
include $RULE_PATH/ddos.rules
include $RULE_PATH/dns.rules
include $RULE_PATH/tftp.rules
include $RULE_PATH/web-cgi.rules
include $RULE_PATH/web-coldfusion.rules
include $RULE_PATH/web-iis.rules
include $RULE_PATH/web-frontpage.rules
include $RULE_PATH/web-misc.rules
include $RULE_PATH/web-client.rules
include $RULE_PATH/web-php.rules
include $RULE_PATH/sql.rules
include $RULE_PATH/x11.rules
include $RULE_PATH/icmp.rules
include $RULE_PATH/netbios.rules
include $RULE_PATH/misc.rules
include $RULE_PATH/attack-responses.rules
include $RULE_PATH/oracle.rules
include $RULE_PATH/mysql.rules
include $RULE_PATH/snmp.rules
include $RULE_PATH/smtp.rules
include $RULE_PATH/imap.rules
include $RULE_PATH/pop2.rules
include $RULE_PATH/pop3.rules
include $RULE_PATH/nntp.rules
include $RULE_PATH/other-ids.rules
# include $RULE_PATH/web-attacks.rules
# include $RULE_PATH/backdoor.rules
# include $RULE_PATH/shellcode.rules
# include $RULE_PATH/policy.rules
# include $RULE_PATH/porn.rules
# include $RULE_PATH/info.rules
# include $RULE_PATH/icmp-info.rules
# include $RULE_PATH/virus.rules
# include $RULE_PATH/chat.rules
# include $RULE_PATH/multimedia.rules
# include $RULE_PATH/p2p.rules
include $RULE_PATH/experimental.rules
# Include any thresholding or suppression commands
include threshold.conf
output database: log, mysql, user=snort password=verso01.. dbname=snort host=localhost