
Introduction
This document specifies the requirements for the design of an ERP Reporting Tool System. This chapter also describes the technical requirements for the whole project. The ERP Reporting Tool on itself is described in the next chapter.
1 Software
1.1 Application runtime platform
The ERP Reporting Tool will be a web-based application. Therefore there are some well-known platforms available: PHP, ASP, ASP.NET, JSP, ColdFusion, Python and Ruby. The choice went to ASP.NET 2.0.
R-1: The ERP Reporting Tool will be built for ASP.NET.
1.1.1 Platform details
Below all platform details are listed.
| Full name: | ASP.NET |
| Version: | 2.0 |
| Homepage: | http://msdn2.microsoft.com/en-us/asp.net/ |
| Language: | English |
| License: | Freeware |
| Notes: | Part of Microsoft .NET Framework 2.0. |
| Installation: | Microsoft .NET Framework Version 2.0 Redistributable Package (x86)http://www.microsoft.com/downloads/details.aspx?familyid=0856eacb-4362-4b0d-8edd-aab15c5e04f5&displaylang=en |
As you can see, the ASP.NET version used for the ERP Reporting Tool is 2.0. This is not the latest version, however, the latest version – version 3.0 – is nothing more than version 2.0 with extra libraries, which we do not use. Therefore only version 2.0 is needed. We will stick to 2.0 because this version is more widely used and has major improvements over version 1.1.
R-2: Version 2.0 of ASP.NET will be used.
1.1.2 Motive
The ASP.NET platform has been chosen because of the reasons below.
- ASP.NET is widely supported and maintained by a major software producer – Microsoft.
- It builds on top of the .NET Framework and brings all its benefits like multiple language support, new software design strategies and patterns, large class library and third party tools, components and libraries.
- The name sounds cool.
- Comes with the free and excellent development tool Visual Web Developer.
- Good documentation and large user base with books, magazines, weblogs, support forums and communities.
- The initial developers have experience with the .NET Framework and know its potential.
1.2 Database software
For storage of data the choice went to Microsoft SQL Server 2005 Express Edition. This is a relatively new database, but closely integrates with ASP.NET. Furthermore Company is already familiar with its stability and performance.
R-3: Microsoft SQL Server 2005 Express Edition will be used for data storage.
1.2.1 Software details
| Full name: | Microsoft SQL Server 2005 Express Edition |
| Version: | 2005 Express Edition, Service Pack 1 |
| Homepage: | http://msdn2.microsoft.com/en-us/sql/aa336346.aspx |
| Language: | English |
| License: | Freeware |
1.2.2 Motive
Microsoft SQL Server Express Edition has been chosen because of the reasons below.
- Provides advanced functionality.
- Easy migration to MS SQL Server 2005.
- Familiar database, Assembléon uses MS SQL Server 2005 for more applications.
- Free, no licensing costs.
1.3 Integrated Development Environment
Microsoft has released some nice tools to develop ASP.NET 2.0 websites. These IDE feature WYSIWYG form development, integrated debugging and programming help.
R-4: Programmers have to use Microsoft Visual Web Developer 2005 Express Edition to develop the ERP Reporting Tool.
1.3.1 Software details
| Full name: | Microsoft Visual Web Developer 2005 Express Edition |
| Version: | 2005 Express Edition, Service Pack 1 |
| Homepage: | http://msdn.microsoft.com/vstudio/express/vwd/ |
| Language: | English |
| License: | Freeware |
1.3.2 Motive
Even though it is possible to program the complete tool in notepad, it is a lot easier and quicker to use Microsoft Visual Web Developer. This IDE has the benefits from below.
- WYSIWYG web page development.
- Component based development.
- Features programming guidance trough features known from Microsoft Visual Studio .NET.
- Good documentation and examples. Most books use Visual Web Developer or Visual Studio .NET.
- Built-in debugger and web server.
- Free, no licensing costs.
1.4 Version control system
For the first phase the Subversion version control system will be used. This tool is easy to deploy and specially designed for source code.
R-5: Subversion will be used for storage of project data and versioning control.
1.4.1 Motive
This system allows us to keep all source code of the project at a centralized spot. Also, it is possible to work on the same files at the same time. Furthermore, every change in the source code is stored and it is possible to view old changes and even bring them back. So we use this system to work together, ensure consistency of the source code and achieve backup possibilities.
1.4.2 Subversion software details
| Full name: | Subversion |
| Version: | 1.4.3 |
| Homepage: | http://subversion.tigris.org/ |
| Language: | English |
| License: | Freeware |
| Installation: | http://subversion.tigris.org/servlets/ProjectDocumentList?folderID=91 |
1.4.3 Subversion configuration
For this system, there is a dedicated Subversion server needed. This task is assigned to the desktop PC HKHHKGEMT1DT060.code1.emi.Philips.com at the Assembléon Hong Kong Ltd. office.
R-6: A Subversion repository is setup at the Assembléon Hong Kong Ltd. office.
To access the Subversion server from Windows clients, it is advised to use TortoiseSVN. This tool nicely integrates with the Windows Shell, so you can easily manage files from the Windows Explorer windows. To download the tool and for more information visit:
http://tortoisesvn.tigris.org/
Before you can connect, you have to request a user account. This can be done through APR-ITC or ask one of the project members.
R-7: Connect to the Subversion repository with TortoiseSVN and your requested account.
1.4.4 TortoiseSVN software details
| Full name: | TortoiseSVN |
| Version: | 1.4.3 |
| Homepage: | http://tortoisesvn.tigris.org/ |
| Language: | English |
| License: | Freeware |
| Installation: | http://tortoisesvn.net/downloads/ |
2 System infrastructure
Because the ERP Reporting Tool we are building is meant for global deployment, this requires a certain setup of the system infrastructure. The system infrastructure involves all hardware to run the ERP Reporting Tool.
2.1 Phased roll-out
This chapter is subject to change because SQL Server replication is reviewed at the moment.
Because the project is divided into two phases, this will also be the same for the roll-out of the system infrastructure. At first the system will be set-up for only the Hong Kong. If this is accepted and the other regions are ready to adapt the tool, the set-up will be revisited for a global infrastructure.
2.1.1 Phase 1: Local operation
Because in this phase the system information data will only be focused on one region, there is no need for synchronization of the data as is the case in phase 2.
R-8: For phase 1 there is only one .NET application server and one MS SQL Database server needed.
R-9: The minimal version of MS SQL Server required for phase 1 is MS SQL Server 2005 Express Edition.
2.1.2 Phase 2: Global operation
This phase will require a .NET application web server and MS SQL database server for each region. Because of the latency in the internet connection between regions it the response time of the system is unacceptable. By placing local servers in each region this problem is solved.
Response time should be verified.
R-10: Each regional server has its own web and database server.
3 Deployment
Thanks to the ASP.NET platform it is very easy to deploy a build of the tool. It only comes down to copying the right files to the right places. The benefit of this is that downtime will be reduced to a minimum.
Although deployment is easy, system administrators still have to be careful with the configuration. First of all, each server has to have the same platform configuration. Second, each region has its own and different Web.Config configuration file. And finally, all regions have their own data storage and therefore also their own user and role management. This setup is illustrated below.
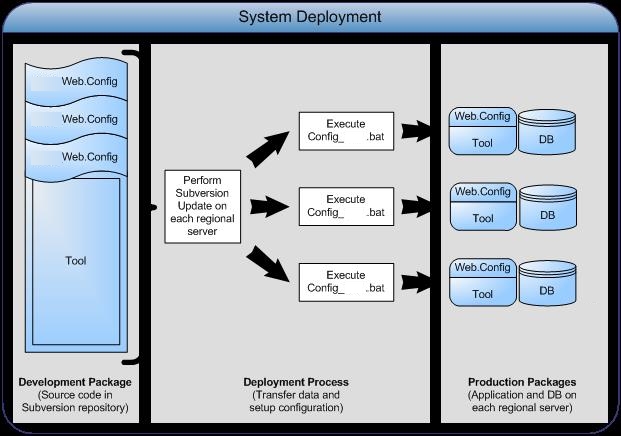
As you can see, the development package is a combination of the tool and several Web.Config files. These Web.Config files are for the specific regions, and should be copied to the right ones. In the end each region will have a local database, only one Web.Config file and the same ERP Reporting Tool.
R-11: Deployment of the system will be done via the procedure described in the System Deployment schema.
3.1.1 Configuration
To deploy the different Web.Config files for each region and at the same time store all those files in the source code repository, batch configuration files will be used. The default Web.Config file will be configured for development purposes. For each region there will be a xxx_Web.Config file, where xxx is replaced by the region abbreviation. Furthermore, for each region there is a .bat file in the repository that can be used to replace the default Web.Config file with the regional one. System administrators just have to execute the right configuration file after each Subversion update.
R-12: Configuration of web servers will be done via batch files.
4 ERP Reporting Tool
This chapter describes the requirements for the tool in detail.
4.1 User & role management
The ERP Reporting Tool uses a flat role definition, so with no hierarchy. This requires that system administrators carefully choose the roles.
R-13: Role management will be provided by ASP.NET and has therefore a flat design: only one level deep.
There are two special roles for regular access: Administrator and User. These roles permit users to use the ERP Reporting Tool. Users who do not have one of these roles, cannot access the ERP Reporting Tool. They will be redirected to a register page.
R-14: Users need an Administrator or User role to access the ERP Reporting Tool.
R-15: Unauthorized users will be redirected to a register page.
It is impossible to remove the preinstalled Administrator and User role. The administrator role is very special because it grants access to all parts (so also report data) of the ERP Reporting Tool. The User role is just to permit access to the ERP Reporting Tool. It will not allow access to data provided by the ERP Reporting Tool.
To access data, the Administrator has to create specific roles, and bind them to data. When a user has that specific role assigned, than that user is granted to view the data.
R-16: Administrator and User role cannot be removed from the system.
R-17: Users need specific roles to access data provided by the ERP Reporting Tool.
4.1.1 Visualization
The user will notice his permissions by functions visible in the tool. Functions that the user is disallowed use will be hidden. For instance, the navigation menu will hide administrator pages when the current user has no administrator role.
R-18: Permissions change the visible functions in the web pages that the users will see.
4.1.2 Profile
Thanks to the ASP.NET profile system, it is relatively easy to store small amounts of personal data for each user. However, relational data can be better stored in an own database scheme for performance reasons.
R-19: Large profile data will be stored in a customized profile data model in the meta-data database.
R-20: Small profile data can be stored in the ASP.NET profile system.
4.2 Web pages
Because of ASP.NET, every page will be a container of controls and other predefined elements. These pages will be placed in a navigational structure as defined in the Functional Requirements document.
Each page itself will have to follow the guidance rules below.
R-21: Use a clear page name logical in the complete navigational structure.
R-22: Try to use the shortest page name possible. Do not repeat terms already used in a lower level of the navigational hierarchy.
R-23: Use a meaningful page class name. Probably reflecting the page name.
R-24: Use for every level in the navigational structure a reflecting namespace to prevent class name collisions.
R-25: Try not to clutter the page with a lot of components. Sometimes it is better to use more pages, popups or wizards.
R-26: For database components, try to keep database communication to a minimum to keep page loading fast.
R-27: Do not use ASP.NET controls if you could use HTML instead to minimize resources.
R-28: Data should be kept visible as much as possible. Unnecessary data should be hidden.
R-29: Scrollbars should be always visible, using overflow CSS elements.
R-30: Document every method and the complete page class itself. Describe what the page does and how the page lifecycle works. Also use inline comments for long or difficult source code.
R-31: Give all controls on the page a useful name.
4.3 Data flow
There are some strict requirements for the data flow, because they are closely related to the goals of the online reporting system. Some of these goals are therefore transformed to requirements below.
R-32: The ERP Reporting Tool should be able to access external databases or data sources.
R-33: Users should be able to compose reports and select which data should be shown. The data will come from the data sources supported by the ERP Reporting Tool.
R-34: Reports will only be shown to people who have the right permissions to access them.
R-35: Users can view reports online and sometimes can store additional data.
When you connect these requirements together you can see a clear relationship in data flow. To better understand this there has been made an implementation proposal.
4.3.1 Implementation
This solution describes how data will be processed in the system. This will be done by several components and therefore there is a flow of data trough the system.
R-36: It should be possible to connect to a data source by its own interface or system file management.
R-37: To make it possible to access different data sources, there will be an adapter for each type of data source.
R-38: A compiler will fetch data from a data source trough the adapter and format it to data that will be useful and readable for the system.
R-39: All data from data sources will be stored in the raw-data database. It also stores additional data inserted by special administration forms.
R-40: With the formatter it is possible to reformulate raw data in a logical sense and produce reports in the form of report structs.
R-41: The meta-data database stores all information needed to output and transform raw data to users.
R-42: Data will be outputted to the user by using report structs to extract the right data from the raw-data database, filter it with the predefined filter and if the user has the right permissions defined by the viewer restrictions, then the user will see a view in the browser.
R-43: Users have the ability to filter a view to reduce the amount of data on the page.
4.4 Third party components
We will use some components from third parties to achieve Excel export of data and to generate graphical data graphs.
4.4.1 Microsoft Excel export
R-44: To export data to Microsoft Excel compatible file format we will use Aspose.Cells.
This component provides all functionality we need to generate native Excel files with all the data preserved from the data shown in the browser. This format will also be used to store snapshots of reports.
4.4.1.1 Software details
| Full name: | Aspose.Cells |
| Version: | 4.1.x.x |
| Homepage: | http://www.aspose.com/ |
| Language: | English |
| License: | Commercial |
| Installation: | Trail version for use during development:http://www.aspose.com/Downloads/Product.aspx?name=Aspose.Cells |
4.4.2 Data graphs
R-45: For rendering graphs of data in reports the ERP Reporting Tool will use .netCharting.
This component provides functionality to generate graphs from data in our database. These will also be included in snapshots.
4.4.2.1 Software details
| Full name: | .netCHARTING |
| Version: | 4.2 |
| Homepage: | http://www.dotnetcharting.com/ |
| Language: | English |
| License: | Commercial |
| Installation: | Trail version for use during development:http://www.dotnetcharting.com/download.aspx |
4.5 Reports and views
First here is a definition of what exactly a report is: a collection of tables, statements and/or graphs.
This collection defines a template how data should be extracted from the raw-data database and represents a logical combination of data. This template can exist out of 3 different types of data representation. This collection, a report, is then stored in the meta-data database.
R-46: By defining tables, statements and graphs, reports can be composed.
After a report is composed, it is impossible to show it directly to the user. First there is a layer of user & role management and filtering on top of that. This is done using views.
R-47: Views are excerpts from reports and used to decrease the amount of data from a report shown to different users.
R-48: Reports and views can be created and maintained by respectively the Report Designer and View Designer.
The Report Designer can be used to setup and maintain tables, statements and graphs. The View Designer can then be used to restrict and grant access to data of the report, by setting and maintaining predefined filters and assign roles.
4.6 Report Designer
By running the Table Wizard, Statement Wizard and/or Graph Wizard, you can manage respectively the tables, statements and graphs in a report design.
A report supports an unlimited amount of tables, statements and wizards. However, it is required to have at least one of them in a report.
R-49: Report data can be shown in 3 ways: textual tabular data, statements or graphs.
R-50: Use the Table Wizard to setup and maintain tables in a report.
R-51: Use the Statement Wizard to setup and maintain statements in a report.
R-52: Use the Graph Wizard to setup and maintain graphs in a report.
R-53: At least one data representation type has to be defined in a report.
4.6.1 Table Wizard
The table wizard is there to make it easier for a user to produce queries to fetch the data from a database. Because users have no knowledge of SQL queries, the wizard provides an easy to understand interface to generate SQL queries in the background.
First a user selects the table to start working with. Then, the user has the ability to build a chain of relationships. Each relation will have a specific representation in the table design. Relations are based upon a master/child principle. Between a master/child-relation, the master has a ‘one’ end and the child a ‘one or more’ end.
R-54: Tabular data has always a master relation.
R-55: Tabular data can have one or more child relations.
For example: an order bill. The order is the master data. It contains information like order date, order number and customer. This order includes one or more items. These items are the child data. Each item describes different data and refers to the master data because it has a relation.
To make these relations visible to the user, the database model has to support the following things:
R-56: Raw-data must have foreign keys, so that relations can be detected.
R-57: Relations in the raw-data database should be documented and described in the meta-data database to show user-friendly aliases.
4.6.1.1 Master/child tabular designs
There are different ways to show master/child relations in a tabular way.
R-58: The ERP Reporting Tool supports 5 table designs shown in the Master/child tabular designs schema.
Below you can see the table designs supported:
- Master-only. This will only show data from the master table. It is not possible to combine this with other master tables.
- Child with repeated master. This shows each child as a unique row. Because multiple children refer to the same master, duplicated master data is possible.
- One master with multiple children. Because multiple masters can refer to the same child, duplicated child data is possible. Can be combined with design 4 and 5.
- Child on master selection. Child data gets only visible when a master is selected. Multiple children are possible. Can be combined with design 3 and 5.
- One master with multiple grouped column children. Childs columns are the result of a group query and therefore represent values of a column. Can be combined with design 3 and 4.
R-59: Some table designs can be combined in one table.
4.6.1.2 Criteria for columns
After the user has composed the table design, the user can adjust every column. One of the properties to set is column data criteria. With this property, data can get filtered from the result.
R-60: Table design column data criteria will be used to formulate the SQL WHERE clause.
R-61: Data criteria can be composed in a tree for OR and AND relations.
4.6.1.3 Filtering data in tables
Filters can be used to reduce the output data based on criteria. When a report table is designed, the user can select if there is need for a filter for each column. The filter reflects the data type of that column and can contain specific properties.
R-62: An optional data specific table column filter can be set in the report designer.
4.6.2 Statement Wizard
The statement wizard uses for the selection of the data the same wizard element from the criteria selection part of the table wizard.
R-63: A statement is a query for the database that will return only one result.
R-64: The criteria selection part of the table wizard should be made isolated so that it can be reused for the statement wizard.
4.6.3 Graph Wizard
Graphs can be defined with the graph wizard. The data that the graph will use will come from existing tables in the report. Depending on the graph type columns from a single table can be selected to represent the data in the graphs.
R-65: Graphs are generated from columns of existing report tables. If the source table changes, the user should be warned that it could damage the graph.
R-66: Graphs are rendered with the .netCHARTING control.
4.7 View Designer
With the View Designer it is possible to create and maintain views.
R-67: It is possible to assign roles to a view to grant access to users who have that role.
R-68: A view can hide tables, statements and graphs from a report.
R-69: A view can hide data in a table by setting a predefined filter.
R-70: A view can hide data in a table by hiding child relations.
R-71: A predefined filter can be set by setting properties of an instance
4.8 Sharing reports
Views can be shared among other users. This can only be done if those users have the same user rights. However, from the user-interface, the user can only select others who have rights at that time.
R-72: Reports can only be shared with users who have got the access rights to the same view.
The sharing function stores the current filters of the view. This enables other users to see exact the same page.
R-73: A shared report is a reference to a stored state of a view.
4.9 Snapshots
Snapshots are exports of reports stored in a static form.
R-74: The ERP Reporting Tool uses Excel files to store static snapshots.
R-75: Snapshots will be stored physical on de server’s local hard drive.
Snapshots are always linked to views, and therefore indirectly to reports. It is possible to put extra comments that users will see before they open the file.
Because of the expected amount of snapshots and difficulties to find the right one, a search function helps with this.
R-76: A search function based on full-text search enables to find snapshots by their description text.
The chosen export format is Excel, because it enables users to access report data and perform calculations from Microsoft Excel. In this way, specific graphs can also be generated.
4.10 Business Data Input
Input forms for business data are custom made because they have very specific requirements. Therefore for each input form there is a custom made ASP.NET Web Form. The data submitted with this form will be stored in a specific data scheme in the raw-data database. This provides the ability for report designers to combine the inserted data with data provided by data sources. In a way, the input form functions as a data source.
R-77: Each business data input form will be defined in its own custom made ASP.NET Web Form.
R-78: Data submitted in a business data input form will be stored in the raw-data database with a specific scheme.
4.11 News messages
News items are displayed on the Main personal page. Some messages are related to user roles, for instance creation notifications of reports. There are also system wide messages, the ones that will be displayed to all users.
R-79: News messages can have a reference to a role and in that case will only be displayed to users who have that role.
5 Data and databases
This chapter describes the way in which data will be stored. Furthermore the chapter describes the data sources of the system and how data will be transferred from data sources to the local RDBMS.
5.1 Data storage
As discussed in the Data flow (3.3) chapter, all data extracted from data sources will be stored in one large database, called the raw-data database. This database follows it own logical data schema, so data sources have to adapt when they are accessed to extract data.
R-80: The raw-data database has a logical data schema for its own data. So it is not dependant of data schemes from data sources. This to ensure standalone data, so data sources will not interfere if they change.
R-81: Data will be stored in a fully normalized way, so with relations. Relations (foreign and primary keys) are required for tables, so that the table wizard can create master/child relations.
R-82: All data tables will have two special fields: flags and timestamp. Flags will indicate the state of a row. Timestamp will indicate the date of the last update.
5.2 Data sources
The data sources that the system is able to support, depends on the specific adapters that have been made. Because the system is built on top of the .NET Framework, it can support some major database systems and file formats by default. However, the adapters are there to support even the most exotic data source. It only depends on the developer if he or she is able to transform the data from the data source in a format that is used in the raw-data relational database.
R-83: Adapters enable the system to access virtually any data source if the developer is able to transform the data to a scheme that can be stored in the raw-data database.
This requirement above can raise the need of manipulating data that comes from a data source. Sometimes data is not relational, or has some gaps. Therefore the system includes an optional procedure that can transform the data in the right way.
R-84: Compilers transform data if necessary to a format that makes more sense so that it can be stored in the raw-data database.
Accessing data is one thing, using it is something else. Putting data in the raw-database is only useful if users can do something with the data. Therefore the data has the following requirements.
R-85: Relational data should be stable; it must refer to existing data.
R-86: There should be checked for gaps in data because of the time difference between refreshes.
R-87: Data should be refreshed in time, so that users are not working with old and incorrect data. Therefore users must have the ability to see how old the data is their working with.
5.3 Isolation & synchronization
Each region will have their own database where they store their regional data. To get access to other regions data, it is possible to access that region’s database. However for fetching of frequently used data like the meta-data, this would give a serious impact on the responsiveness of the system because of the internet connection latency. Therefore, this meta-data of each regional server will be synchronized to the other regions at predefined intervals. In this way regions can access their own local database to fetch the synchronized data. For the intermediate data however, the system still has to connect to the other region database.
R-88: Regions store their data in their local database.
R-89: Meta-data will be synchronized between all the regions.
R-90: Users of the system have to bare in mind the delay of regional data synchronization.
To distinct the data of each region, all the meta-data database tables will have a region column that will act like a flag. This flag indicates for which region this data row is meant. Although it is possible for other regions to edit this data, in their local database, they may not do that. Also, displaying this data must be restricted in the application so that only permitted persons will be able to see it.
R-91: Meta-data tables need to have a region column to indicate the region the data belongs to.
R-92: Regions should only edit their own regional data in their database.
R-93: Regions must only show only data permitted for the current user in that region.